Calculations with Radioactivity


Efficiency of detecting radioactivity

Efficiency is the fraction of the radioactive disintegration that are detected by the counter. Determine efficiency by counting a standard sample under conditions identical to those used in your experiment.

With 125I, efficiencies are very high, over 90%. It depends on the geometry of the counter. The detector doesn't entirely surround the tube, so a few gamma rays (photons) miss the detector.

With 3H, the efficiency of counting is much lower, often about 40%. The low efficiency is mostly a consequence of the physics of decay, and can not be improved by better instrumentation or better scintillation fluid. When a tritium atom decays, a neutron converts to a proton and the reaction shoots off an electron and neutrino. The energy released is always the name, but it is randomly partitioned between the neutrino (not detected) and an electron (that we try to detect). When the electron has sufficient energy, it will travel far enough to encounter a fluor molecule in the scintillation fluid. This fluid amplifies the signal and gives of a flash of light detected by the scintillation counter. The intensity of the flash (number of photons) is proportional to the energy of the electron. If the electron has insufficient energy, it is not captured by the fluor and is not detected. If it has low energy, it is captured but the light flash has few photons and is not detected by the instrument. Since the decay of many tritium atoms does not lead to a detectable number of photons, the efficiency of counting is much less than 100%.

Efficiency of counting 3H is reduced by the presence of any color in the counting tubes, if the mixture of water and scintillation fluid is not homogeneous, or if the radioactivity is trapped in tissue chunks (so emitted electrons don't travel into the scintillation fluid).


Specific radioactivity

When you buy radioligands, the packaging usually states the specific radioactivity as Curies per millimole (Ci/mmole). Since you measure counts per minute (cpm), the specific radioactivity is more useful when stated in terms of cpm. Often the specific radioactivity is expressed as cpm/fmol (1 fmol = 10-15 mole).

To convert from Ci/mmol to cpm/fmol, you need to know that 1 Ci equals 2.22 x 10¹² disintegrations per minute. Use this equation to convert Z Ci/mmole to Y cpm/fmol when the counter has an efficiency (expressed as a fraction) equal to E.

Note: You may also encounter the unit Becquerel, which equals one radioactive disintegration per second.


Calculating the concentration of the radioligand

Rather than trust your dilutions, you can accurately calculate the concentration of radioligand in a stock solution. Measure the number of counts per minute in a small volume of solution and use this equation. C is cpm counted, V is volume of the solution you counted in ml, and Y is the specific activity of the radioligand in cpm/fmol (calculated in the previous section).


Radioactive decay

Radioactive decay is entirely random. A particular atom has no idea how old it is, and can decay at any time. The probability of decay at any particular interval is the same as the probability of decay during any other interval. If you start with N0 radioactive atoms, the number remaining at time t is:

Kdecay is the rate constant of decay expressed in units of inverse time. Each radioactive isotope has a different value of Kdecay.

The half-life (t½) is the time it takes for half the isotope to decay. Half-life and decay rate constant are related by this equation:

This table shows the half-lives and rate constants for commonly used radioisotopes. The table also shows the specific activity assuming that each molecule is labeled with one isotope. (This is often the case with 125I and 32P. Tritiated molecules often incorporate two or three tritium atoms, which increases the specific radioactivity.)
Isotope Half life Kdecay Specific radioactivity
3H 12.43 years 0.056/year 28.7 Ci/mmol
125I 59.6 days 0.0116/day 2190 Ci/mmol
32P 14.3 days 0.0485/day 9128 Ci/mmol
35S 87.4 days 0.0079/day 1493 Ci/mmol

You can calculate radioactive decay from a date where you knew the concentration and specific radioactivity using this equation.

For example, after 125I decays for 20 days, the fraction remaining equals 79.5%. Although data appear to be scanty, most scientists assume that the energy released during decay destroys the ligand so it no longer binds to receptors. Therefore the specific radioactivity does not change over time. What changes is the concentration of ligand. After 20 days, therefore, the concentration of the iodinated ligand is 79.5% of what it was originally, but the specific radioactivity remains 2190 Ci/mmol. This approach assumes that the unlabeled decay product is not able to bind to receptors and has no effect on the binding. Rather than trust this assumption, you should always try to use newly synthesized or repurified radioligand for key experiments.


Counting error and the Poisson distribution

The decay of a population radioactive atoms is random, and therefore subject to a sampling error. For example, the radioactive atoms in a tube containing 1000 cpm of radioactivity won't give off exactly 1000 counts in every minute. There will be more counts in some minutes and fewer in others, with the distribution of counts following a Poisson distribution. This variability is intrinsic to radioactive decay and cannot be reduced by more careful experimental controls.

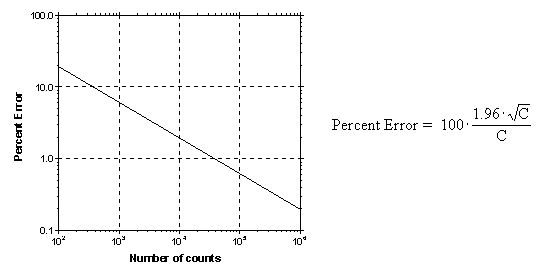
After counting a certain number of counts in your tube, you want to know what the "real" number of counts is. Obviously, there is no way to know that. But you can calculate a range of counts that is 95% certain to contain the true average value. So long as the number of counts, C, is greater than about 50 you can calculate the confidence interval using this approximate equation:

Computer programs can calculate a more exact P value (these calculations necessary when C is less than about 100) For example, if you measure 100 radioactive counts in an interval, you can be 95% sure that the true average number of counts ranges approximately between 80 and 120 (using the equation here) or more exactly between 81.37 and 121.61 (using the more exact equation).

When calculating the confidence interval, you must set C equal to the total number of counts you measured experimentally, not the number of counts per minute.

Example: You placed a radioactive sample into a scintillation counter and counted for 10 minutes. The counter tells you that there were 225 counts per minute. What is the 95% confidence interval? Since you counted for 10 minutes, the instrument must have detected 2250 radioactive disintegrations. The 95% confidence interval of this number extends from 2157 to 2343. This is the confidence interval for the number of counts in 10 minutes, so the 95% confidence interval for the average number of counts per minute extends from 216 to 234. If you had attempted to calculate the confidence interval using the number 225 (counts per minute) rather than 2250 (counts detected), you would have calculated a wider (incorrect) interval.

The Poisson distribution explains why it is helpful to count your samples longer when the number of counts is small. For example, this table shows the confidence interval for 100 cpm counted for various times. When you count for longer times, the confidence interval will be narrower.

1 minute 10 minutes 100 minutes
Counts per minute (cpm) 100 100 100
Total counts 100 1000 10000
95% CI of counts 81.4 to 121.6 938 to 1062 9804 to 10196
95% CI of cpm 81.4 to 121.6 93.8 to 106.2 98.0 to 102.0

This graph shows percent error as a function of number of counts (C). Percent error is defined from the width of the confidence interval divided by the number of counts: